Events
Inspect the click, lead, sale, and custom-event feed behind the analytics totals.
Events is the chronological feed behind the analytics tiles. Totals at the top match Analytics for the selected UTC window (7 / 30 / 90 days). The table is the individual rows.
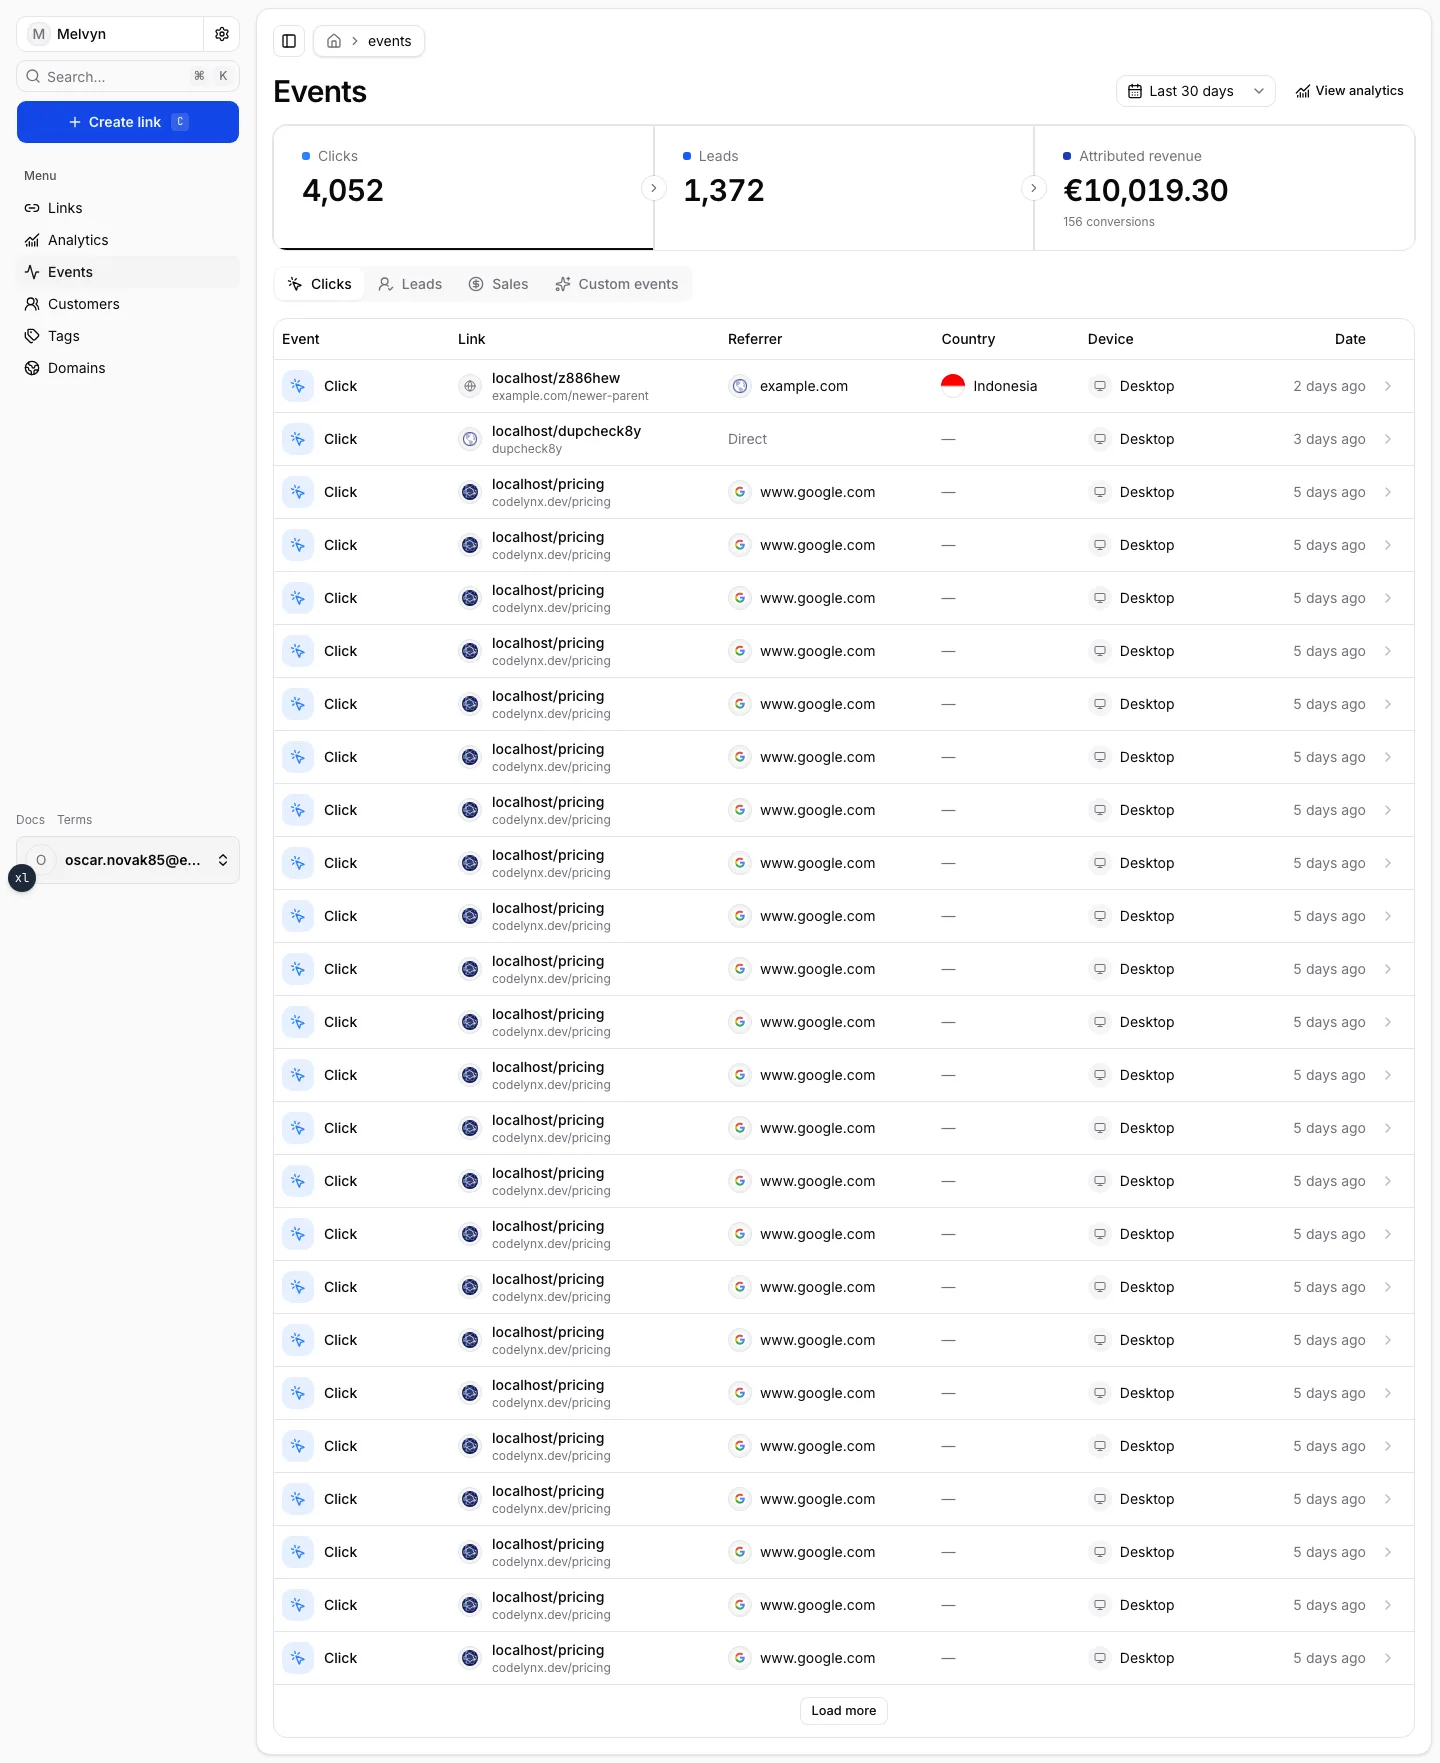
The four tabs
| Tab | What each row is |
|---|---|
| Clicks | One open of a short URL: link, referrer, country, device, time. |
| Leads | An identify / lead that bound a visitor to a customer. |
| Sales | A trusted conversion or revenue event from your server. |
| Custom events | Named product events (kliq.track) that are not leads or sales. |
The overview tiles still only light up Clicks, Leads, and Attributed revenue. Custom events sit beside leads in storage, so that tab borrows the leads tile rather than inventing a fourth funnel stage.
Click a tile to jump to its tab. View analytics opens the same window on the Analytics page.
How a click is recorded
A visitor hits domain/slug. Kliq looks up the indexed redirect, records
the click (IP, user-agent, geo when the edge provides it, referrer, UTM),
and sends the browser to the destination with a click identifier (lf_id).
That identifier is what the first-party SDK stores. Without it, later
lead / identify calls can still create a customer, but they show as
unattributed. See Attribution.
After the monthly tracked-click allowance, redirects keep working. The click is still recorded and still shows in this feed, but it stops counting towards analytics totals.
Reading a row
Click rows show the short URL, destination favicon, referrer (or Direct), country, device, and relative time. Lead / sale / custom-event rows show the event name, the attributed link when there is one, and the customer.
Load more paginates 25 at a time. The feed is not a replacement for ClickHouse exports — use the Analytics API for bounded date-range totals.
Next
- Customers — the person those leads belong to
- Attribution and Events — how to send them